Monitoring
HPCBOX provides both Job level and cluster level monitoring information.
Job Monitoring
Every workflow pipeline on HPCBOX is a collection of multiple steps in the workflow and each step in the workflow is submitted as a job to the underlying scheduling system.
Every job has an ID, Name, State, Owner (the cluster user) and number of slots/cores its using through the underlying scheduling system.

The job can have multiple states, more information can be found using man qstat. However, the most common states are
- qw: Queued and awaiting execution.
- r: Running
- d: Awaiting deletion.
Job Actions
There are three actions which the user can perform on a job. These are invoked using one of the three icons in the Actions column. Multiple jobs can be selected when performing one of the actions below.
Show Logs
The current job log, meaning the stdout and stderr for a job can be viewed using this option. This will open an xterm window and display the log file.
Follow Logs
The follow log option can be used to continuously follow the job log, this is useful for jobs which output a lot directly to the console.
Kill
Jobs can be killed using the option.
Some jobs can take a few minutes to cleanup before exiting the queue and will remain in dr state while cleanup is ongoing. This is true specifically for tightly integrated distributed MPI jobs.
Hard Kill
A hard kill forces a job deletion. This option can be used if a job is stuck for a long time in dr state without leaving the queue.
When following multiple job logs simultaneously, one can use the window tiler tool to tile windows in a grid. This tool appears at the right side of your desktop panel.

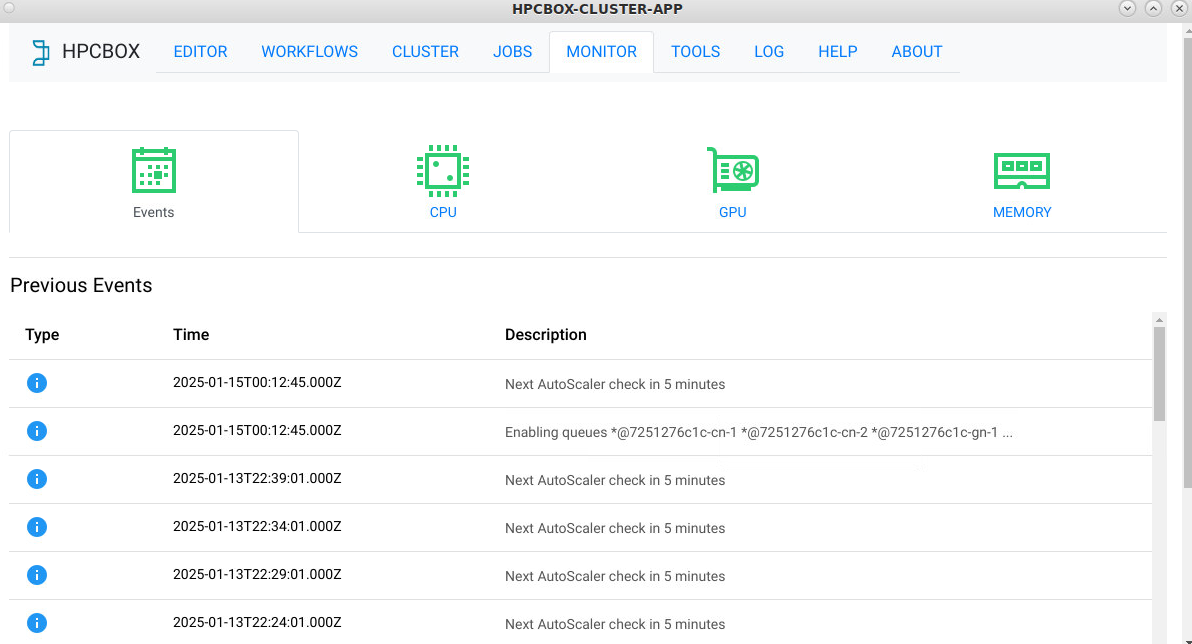
Cluster Monitoring
The monitoring section displays aggregated charts showing worker utilization including charts for load, GPU, memory use and events generated by the AutoScaler. It could take a few minutes for the graphs to appear.

Comprehensive Monitoring
To view more detailed monitoring, please open a browser window within your HPCBOX desktop and visit http://localhost/ganglia
Autoscaler Monitoring
All activities performed by the HPCBOX AutoScaler are logged in the Events section of the Monitoring panel.